

4
Down
10
collect
Report
share
Wolfram Mathematica 对复变函数的另一种可视化方法

非数学专业,但是对数学概念以及公式,函数的可视化很感兴趣
学习了数学物理方法之后一直在寻找能够可视化复变函数的方法,目前可视化的方法有这几种:相位和幅度图,色彩和高度绘制函数的相位和幅度,向量图等等。复变函数可视化难的主要是需要可视化4个维度,在三维图中只能可视化3个维度,所以引入第四个变量--色彩来作为可视化,但是效果并不那么直观。
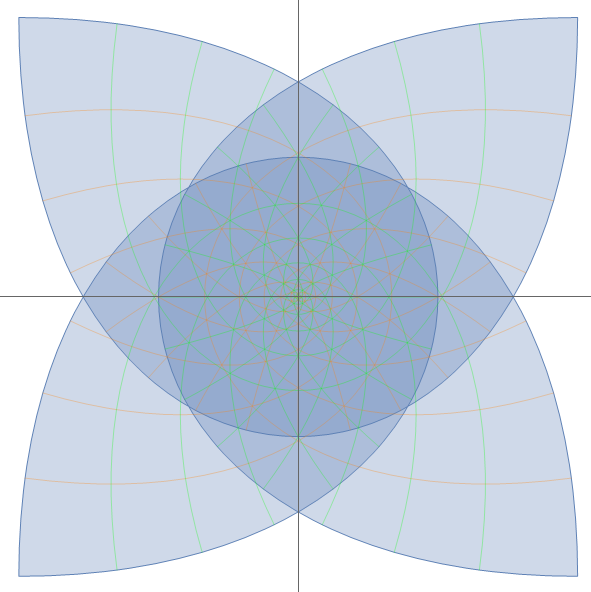
了解到复变函数是一种能描述空间变化的函数并且看了3b1b的可视化视频之后,就有了对复变函数的可视化的另一种方法,也就是较为直观的展示空间是如何被复变函数扭曲的。
这里使用的是wolfram mathematica,这个软件应该说是数学,物理相关专业学生的福音,要比他的竞品matlab在可视化这方面要好上太多了,出于想推荐一下这个软件以及水点文章赚点积分。。
#2 test
以下是一点阅读时深有感触的体会:
在重修的过程中,我仔细分析了每一个公式,试图给这个公式以一个直观的理解。虽然我知道对于研究数学的人来说,这样的学习方法完全没有前途可言,因为随着概念愈加抽象,维度越来越高,这种图像或者模型理解法将完全丧失作用。但是对于一个工科生来说,足够了。
range=6;
f[x_]:=(x)^3;
ListAnimate[Table[ParametricPlot[{Re[f[u+I*v]*an^2+(u+I*v)*(1-an^2)],Im[f[u+I*v]*an^2+(u+I*v)*(1-an^2)]},{u,-range,range},{v,-range,range},MeshStyle->{Orange,Green},PlotRange->Full,Mesh->Automatic],{an,0,1,1/60}],30]
Player version:
5.4.0
Video url:
Video volume:
Video time:
Video duration:
Video resolution:
x
[x]
DeclarationAll articles on this site, unless otherwise indicated or marked, are original publications of this site. Any individual or organization is prohibited from copying, stealing, collecting, or publishing the content of this site to any website, book, or other media platform without the consent of the author. If the content of this site infringes upon the legitimate rights and interests of the original author, please contact us for processing: DMCA Report












This guy seems to be very shy (bushi
1. Web links(www.wolframcloud.com)这个三维图像可以在网页上旋转视角观察的
2.Web links(www.wolframcloud.com)
我觉得在复杂的函数下使用我这个可视化方法不太有用,主要是变换太复杂了导致不能有效看出变化过程
This guy seems to be very shy (bushi
This guy seems to be very shy (bushi
This guy seems to be very shy (bushi
This guy seems to be very shy (bushi
This guy seems to be very shy (bushi